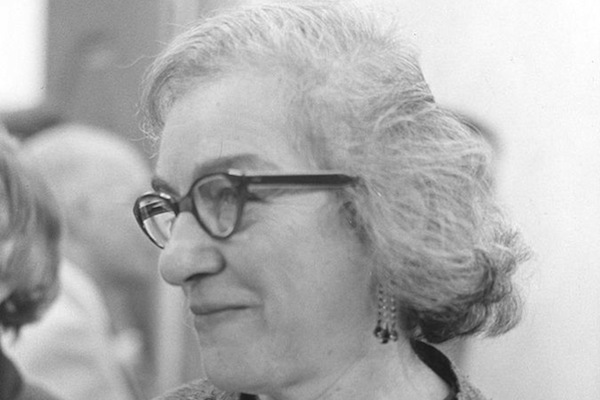
Photo by: Library of Congress
Mollie Orshansky, the federal statistician who came up with the first poverty measure in the 1960s. Accurate then, the updated version is out of step with modern economic reality.
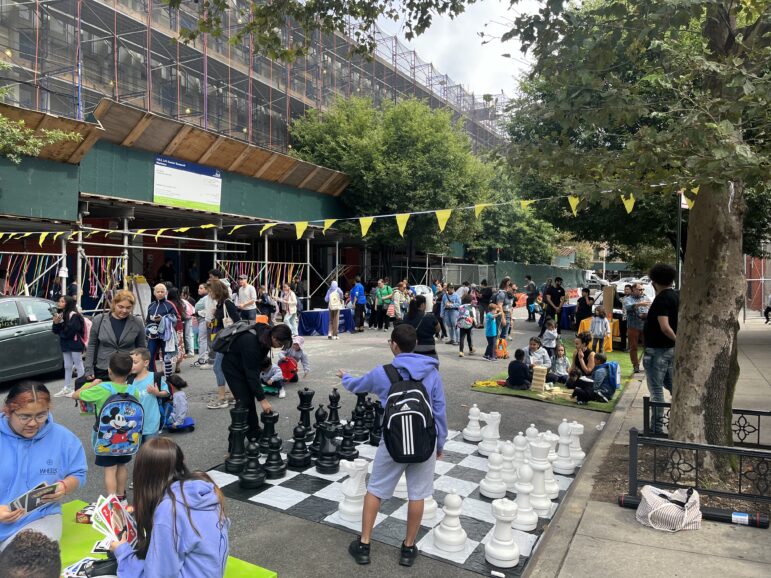
Economists, advocates and commentators were dissecting, interpreting and spinning new U.S. Census statistics on poverty released in the latter part of September. It was big news. Nationally the U.S. poverty rate declined from 15 percent to 14.5 percent, the first statistically significant, if pretty modest, dip in poverty since pre-recession 2006 when poverty was at 12.3 percent. But the number of people living below the poverty line was stuck at 45.3 million. And median household income was $51,939, a decrease in real dollars over the past couple of years and barely above what it was in 1995.
Most of us don’t swim in the numbers ourselves, so we’ll have to take our favorite expert’s word for what it means, I suppose. That makes it an appropriate time for people interested in poverty, U.S. style, to think about how those new numbers we’re hearing so much about are used to measure poverty and determine who gets what from government, and who gets none. It’s a time to question why we keep using outdated methods guaranteeing inaccurate outcomes.
The U.S. system for setting poverty levels is based on an outdated concept of how typical families spend money, makes almost no accounting for differences in cost of living among different regions, and fails to account for the impact of some government benefits and taxes.
New York City actually set up their own research and statistics operation, the Center for Economic Opportunity (CEO), to create their own poverty measurement. The latest available CEO poverty threshold figure, for 2012, is $31,039 for a family of four. The comparable U.S. poverty threshold was $23,283. Very simplistically, the “definition disagreement” was a cool $7,756 that year. That’s $646.33 a month. In 2012, the city’s official poverty rate was 20 percent. The CEO pegged it at 21.4 percent. That might not seem like a big difference, but it amounts to over 100,000 people.
Certainly, a rational system would produce huge changes with winners and losers. The winners and losers wouldn’t be random. It would almost certainly be a massive shift in income to cities and to communities of color. In the end the “we’ve always done it like this” explanation may be the best argument in favor of the curious way we set poverty thresholds because, politically, we have no choice. Even if it doesn’t make sense, we’ll never be able to agree to a different policy.
To better understand why what appears irrational keeps happening, re-read that last sentence replacing the word “place” with “district”, as in Congressional District.
It’s not like no one ever thought about imposing better measurements. There are hundreds of proposed measurements and methodologies, mostly in academia. The National Academy of Science (NAS) recommended rationalizing poverty measurement more than 20 years ago. There recommendations would base the poverty line on not just food costs but clothing, shelter, utilities, transportation and all the things people really need to live. It’d be calculated by actual cost of living in an area, not just one national figure. They’d have a comprehensive definition of income including the value of in-kind benefits and the impact of payroll taxes. New York City’s CEO’s measurements are largely based on the NAS recommendations.
The Obama administration created that sort of alternative poverty threshold measurement, the Supplemental Poverty Measure or “SPM”, that will be announced later this year. It’s used heavily for research purposes but by policy is never used to set poverty thresholds or eligibility for poverty programs. That’s really just a measure of … well, what we should do if we want a real poverty measure—a tribute to how things would work if they weren’t controlled by the politics of print outs that so accurately tell us which communities would win or lose under each alternative scenario.
In fact, the SPM has already painted a portrait of how using a rationale poverty measure would affect poverty, and therefore benefits and funding, across the country. Based on Census Bureau analysis for the three-year period from 2010 through 2012, the SPM poverty threshold would benefit more people. In 2012 instead of 47 million below poverty it would have been 49.7 million. Much of the increase would come from defining the household unit differently, to include unrelated children in the care of the household and unmarried cohabitating couples and their children as households. While it would have lowered the poverty rate among children under 18, it would’ve increased it for low-income workers, the foreign-born, seniors and people living in large metropolitan statistical areas, especially in the big cities in those metro areas. More benefits would have gone to the northeast and west, but less to the south.
The geography of the SPM change is pretty dramatic. “Winner states” – those increasing benefits by over a full percentage point of their population and bringing millions and millions of public dollars into their states, include California, Connecticut, Florida, Maryland, Massachusetts, Nevada, New Hampshire, New Jersey, New York, Ohio, Virginia and the District of Columbia.
“Loser” states would have included Alabama, Arkansas, Idaho, Kansas, Kentucky, Louisiana, Mississippi, Missouri, Montana, New Mexico, North Carolina, North Dakota, Oklahoma, South Carolina, South Dakota, Tennessee and West Virginia. It’s not a perfect match up, but that first set of states looks like a political sea of blue and the second set of states would be awash in political red.
Any change would have to overcome profound ideological differences. How do you compromise when liberals generally think poverty programs deliver too little and conservatives are sure they give far too much? How do you mediate when the changes appear so politically significant in one direction?
In an atmosphere of partisan gridlock where the two sides can’t take action even when they do seem to have common ground, it’s likely that we won’t need higher math to measure progress on the issue of the poverty threshold.